ADVFN FREE Streaming stock market data

Mechnical Trading

Here i will post both entries and exits signals generated by various mechanical strategies. Will practical live actions break the glorious signals? A battle of psychology vs logical shall begin!

Tuesday, September 20, 2005

Wave - EOD (Introduction)

Wave-EOD is an effective end-of-day investment tool for mid-term (days to weeks) investors, providing candlestick formation scanning, indicators scanning and divergence scanning. Plus tracking features like portfolio entry, order reports, trading statistics reports. Allow flexible customization on the charting indicators and on the brokerage commission, tax, etc.

Target Audience:
Wave-EOD offers a low-cost, effective money-making tool for (not limited to) mid-term (days to weeks) securities investors.

Software Requirements:
Operating System supported: Windows, Linux.
Database supported: Oracle, PostgreSQL(in progress).
Library required: Java 1.5

Hardware Requirements:
500mhz P3 processor & above
256mb RAM
100mb harddisk space
Internet connection (Modem 56.6k, Broadband)

Wave - EOD (Features)

Securities Analyzer
Displays information, indicator signals and intraday quote of the selected securities. Allow order entry for portfolio tracking and future reference.

  • Displays information such as code, market, currency and sector of the securities.
  • Displays the intraday / end-of-day snapshot quote of the securities.
  • Displays the indicator signals and divergences of the securities.

  • Provides an order entry interface for user to track their portfolio and returns.


Market Analyzer
Provides the ease of finding the securities via a market, alphabetical filter. Provides snapshot of market summary and candlestick formation scanning reports.

  • Offers a market and securities alphabetical filter to ease the search of securities.

  • Performs summation of the entire market for top 10 information like volume, rise $, fall $.
  • Plus intensive scan of the entire market for specific candlestick formation. Explanation on the formation is also provided for better understanding and usages.


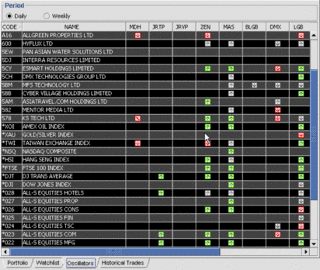
Indicators Scanner
Effective alarms of indicators signals based on the scanning of selected indicators for signals and divergences.


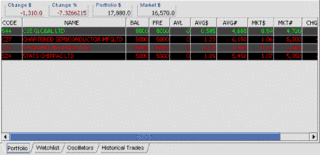
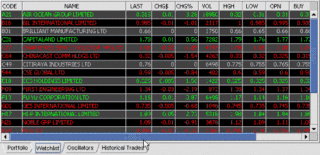
Securities Tracker
Structured view of the portfolio, dynamic watchlist and historical trades.

  • Displays portfolio summary and individual securities summary such as cumulative entry price, quantity and current P/L.

  • Offers a dynamic (drag-n-drop) list of securities that user wishes to track.

  • Shows a list of historical trades with information such as quantity, value, commission, etc.


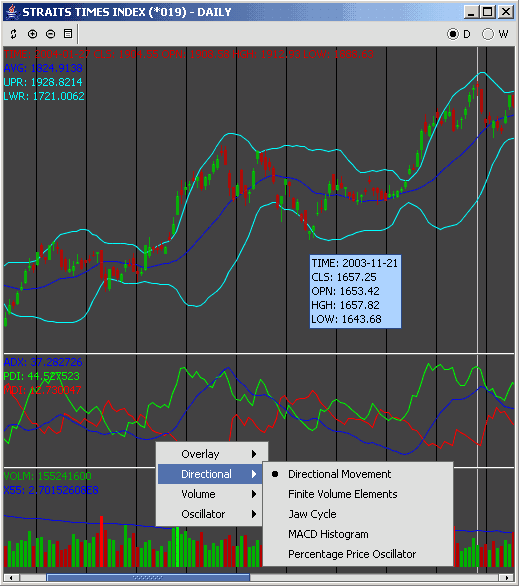
Chart Plotter
Plot daily and weekly charts with single or multiple indicators. Allow customization of indicator parameters and perform back-testing of system.

  • More than 50 popular indicators like MACD, Stochastic, BollingerBands, etc. available for selection, each classified under different categories.

  • Allows multiple indicators on the same securities with auto-dynamic scaling and plotting of chart.

  • Each indicator's parameters can be easily adjusted to suit your preference. Divergence & signals can be enabled or disabled for better viewing.


Trade Analyzer
Generate statistical summary of the trade done. And generate the billing statement based on contra rules & commission of the brokerage.